Diet & Chronic Disease
Most of the illness that shortens life in wealthy countries is slow: arteries that stiffen over decades, blood sugar that drifts upward for years before anyone notices, bone that thins so quietly it announces itself only as a fracture. Diet is one of the levers on all of it — but the size and the certainty of that lever vary enormously from claim to claim, and the popular version of nutrition science routinely oversells both. This chapter walks through what the evidence actually supports for cardiovascular disease, type 2 diabetes, cancer, and bone health, and it is honest about where the evidence is strong, where it is suggestive, and where it is little more than a plausible mechanism. It ends with the single most robust finding in the whole field: that overall dietary patterns predict health far better than any individual nutrient does. Nothing here is medical or dietary advice for an individual — it is the background you need to read a headline, a label, or a research abstract without being fooled.
By the end of this chapter you can
- Explain how saturated, unsaturated, and trans fats differ in their effect on LDL cholesterol, and why what replaces a fat matters as much as the fat itself.
- State the current sodium and potassium intake references for adults, with units, and describe where most dietary sodium actually comes from.
- Describe the physiology linking insulin resistance, body fatness, and type 2 diabetes, and summarize what carbohydrate quality versus quantity contributes to risk.
- Interpret the IARC classification of processed meat and alcohol, and explain why a hazard class is not the same thing as a risk magnitude.
- Distinguish evidence that is strong (consistent trials plus mechanism) from evidence that is preliminary (single cohorts, surrogate endpoints, mechanism alone).
- State the adult RDAs for calcium and vitamin D, note how they differ by age and sex, and name the deficiency syndromes.
- Compare the Mediterranean, DASH, and plant-based patterns and identify the features they share.
- Explain why single-nutrient supplement trials have so often failed to reproduce the benefits seen with whole-diet patterns.
Section 1Diet and cardiovascular disease
Lipids: what the blood is actually carrying
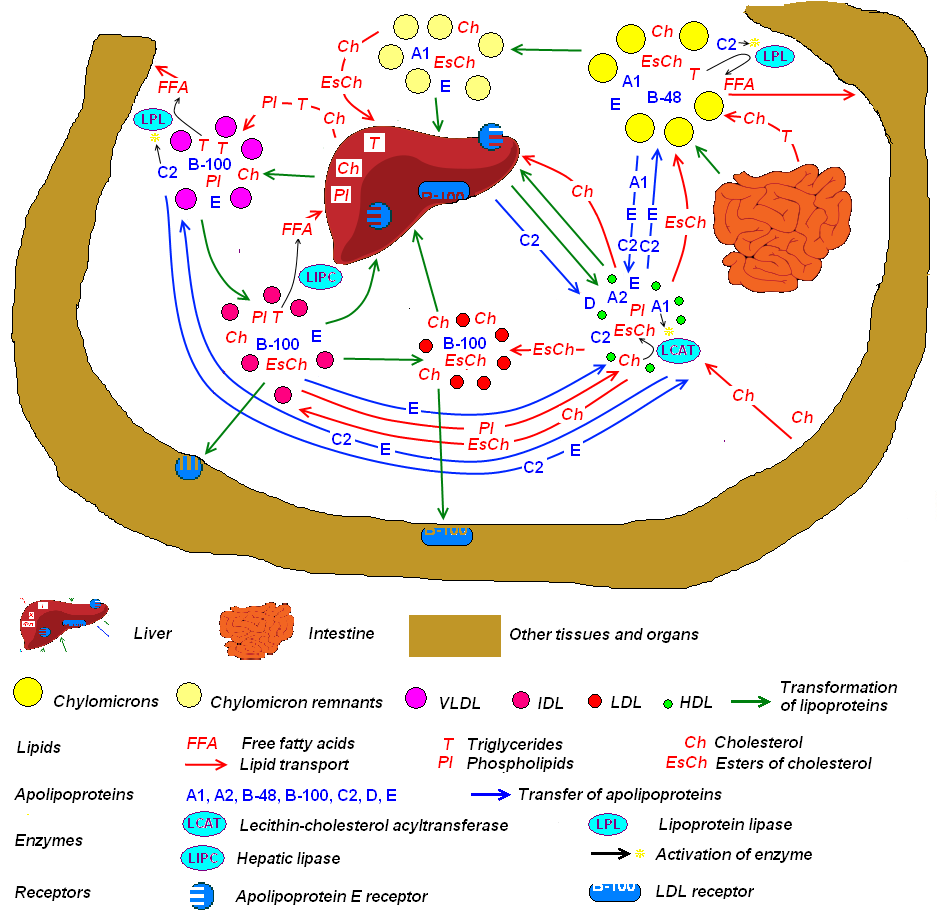
Fat does not dissolve in plasma, so the body packages it. Lipoproteins are shells of phospholipid and protein wrapped around a cargo of triglyceride and cholesterol, and they differ mainly in what they are carrying and where they are going. Chylomicrons haul dietary fat out of the gut. VLDL exports triglyceride made by the liver. As VLDL unloads triglyceride it shrinks into LDL, the cholesterol-rich particle that delivers cholesterol to tissues — and, when it lodges in an arterial wall and is oxidized, the particle that seeds an atherosclerotic plaque. HDL runs the other direction, collecting cholesterol for return to the liver.
The link between LDL cholesterol and atherosclerosis is about as strong as evidence in nutrition and medicine gets: it is supported by animal work, by human genetics (people who inherit lifelong low LDL have lifelong low cardiovascular risk), and by many large randomized drug trials in which lowering LDL lowered heart attacks. Note carefully what that establishes — that LDL is causal. It does not automatically mean any given food raises risk. HDL is a different story: low HDL reliably predicts risk, but drugs and genetic variants that raise HDL have generally failed to reduce events, which is a useful reminder that a marker that travels with disease is not necessarily a cause of it.
Which fats do what
Dietary fats change LDL in predictable directions. Saturated fat raises LDL cholesterol relative to unsaturated fat. Industrial trans fat from partially hydrogenated oil is worse still — it raises LDL and lowers HDL — which is why regulators in the United States withdrew its "generally recognized as safe" status in 2015 and it has since largely disappeared from the food supply, and why the World Health Organization has pushed for global elimination. Polyunsaturated and monounsaturated fats lower LDL when they take saturated fat's place.
That last clause carries most of the weight. Every food you remove is replaced by something, and the comparison is what the evidence measures. Trials and pooled cohorts agree that replacing saturated fat with polyunsaturated fat reduces cardiovascular events; replacing it with refined carbohydrate does not. A study that reports "saturated fat was not associated with heart disease" without saying what replaced it has answered a question nobody asked. Dietary cholesterol itself — the cholesterol in an egg yolk or shrimp — turns out to have a modest and highly variable effect on most people's blood LDL, which is why the old blanket 300 mg/day cap was dropped from United States dietary guidance in 2015.
| Fat type | Typical sources | Effect on LDL | Strength of evidence |
|---|---|---|---|
| Saturated | Fatty meat, butter, cheese, coconut and palm oil | Raises LDL vs unsaturated fat | Strong (many controlled feeding trials) |
| Industrial trans | Partially hydrogenated oil (now largely removed) | Raises LDL and lowers HDL | Strong; no safe intake identified |
| Monounsaturated | Olive oil, canola, avocado, most nuts | Lowers LDL when replacing saturated fat | Strong |
| Polyunsaturated (n−6) | Soybean, corn, sunflower oil, seeds | Lowers LDL; lowers events on substitution | Strong |
| Long-chain n−3 (EPA/DHA) | Salmon, sardines, mackerel, herring | Lowers triglyceride; little LDL effect | Moderate for fish in the diet; weak for general-population supplements |
Sodium, potassium, and blood pressure
High blood pressure is the largest single contributor to cardiovascular death worldwide, and sodium intake moves it. In controlled feeding trials, cutting sodium lowers blood pressure in a dose-dependent way, with larger drops in people who already have hypertension, in older adults, and in those who are constitutionally "salt sensitive." The current United States reference values for adults 19 years and older are an Adequate Intake of 1,500 mg/day of sodium and a separate Chronic Disease Risk Reduction intake of 2,300 mg/day — the level above which reducing intake is expected to lower chronic disease risk. Average intake in the United States runs near 3,400 mg/day, and roughly seven of every ten of those milligrams arrive already dissolved in packaged and restaurant food, not from the shaker at the table.
Potassium works in the other direction, promoting urinary sodium loss and vascular relaxation. The 2019 Adequate Intake for adults is 3,400 mg/day for men and 2,600 mg/day for women (these figures were revised downward from an earlier 4,700 mg value; values also differ for adolescents, pregnancy, and lactation). Most people fall well short, and the richest sources are unglamorous: potatoes, beans, leafy greens, bananas, tomatoes, yogurt, and other minimally processed plant and dairy foods. Viscous soluble fibers — the beta-glucan in oats and barley, psyllium — add a small independent LDL reduction by binding bile acids in the gut.
- LDL cholesterol is causally linked to atherosclerosis; HDL predicts risk but raising it has not reduced events.
- Saturated and industrial trans fats raise LDL; unsaturated fats lower it when they replace saturated fat — refined carbohydrate replacement does not help.
- Adult sodium references: AI 1,500 mg/day, CDRR 2,300 mg/day; average United States intake is about 3,400 mg/day, mostly from packaged and restaurant foods.
- Potassium AI for adults is 3,400 mg/day (men) and 2,600 mg/day (women); most people do not reach it.
Section 2Diet and diabetes
What goes wrong in type 2 diabetes
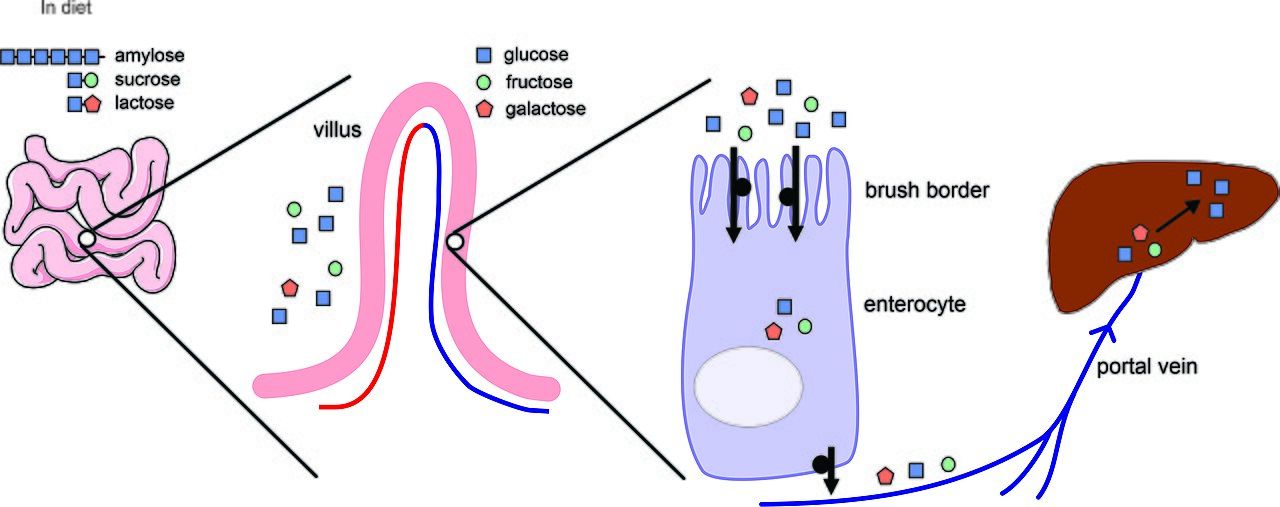
Every digestible carbohydrate you eat — starch, sucrose, lactose — is dismantled to monosaccharides before it crosses the intestinal wall, and most of it arrives in the blood as glucose. Insulin is the signal that tells muscle, liver, and adipose tissue to take that glucose up and store it. In type 2 diabetes, two things go wrong together: tissues respond poorly to insulin (insulin resistance), and the pancreatic beta cells eventually cannot secrete enough extra insulin to compensate. Blood glucose then climbs. The process is gradual, which is why prediabetes — a fasting glucose of 100–125 mg/dL or an HbA1c of 5.7–6.4% — can persist silently for years before diabetes is diagnosed at a fasting glucose of 126 mg/dL or higher, or an HbA1c of 6.5% or higher.
Excess adipose tissue, particularly visceral fat around the organs, is among the strongest predictors of insulin resistance. That is a statement about physiology, not about character: adipose tissue is metabolically active, releasing free fatty acids and inflammatory signals that interfere with insulin action, and how much of it a person carries is shaped by genetics, medications, sleep, stress, food access, and income at least as much as by anything a person chooses at a meal. Risk also rises with age, with family history, and is higher in several populations at lower body weights — South Asian populations in particular develop insulin resistance at lower body mass index than European-ancestry populations.
Carbohydrate: amount versus quality
The RDA for carbohydrate is 130 g/day for adults and children, a figure set by the brain's obligate glucose demand, rising to 175 g/day in pregnancy and 210 g/day in lactation. The Acceptable Macronutrient Distribution Range is 45–65% of energy from carbohydrate. Remember the energy yields underneath all of this: carbohydrate 4 kcal/g, protein 4 kcal/g, fat 9 kcal/g, alcohol 7 kcal/g.
What the evidence supports reasonably well is that carbohydrate quality tracks with type 2 diabetes risk more consistently than carbohydrate quantity. Higher whole-grain intake is associated with lower risk across many large cohorts; sugar-sweetened beverages are associated with higher risk, and the association survives adjustment for body weight, suggesting more than a simple calorie story. The evidence for glycemic index as a standalone tool is weaker and more inconsistent than its popularity implies — the index is measured on isolated foods in fasting subjects, and mixed meals behave differently. For people who already have type 2 diabetes, low-carbohydrate patterns improve HbA1c over three to six months, but the advantage over other patterns narrows by twelve months, and adherence explains much of the difference. Several patterns work; none is uniquely correct.
| Factor | Direction of association with type 2 diabetes | Evidence |
|---|---|---|
| Whole grains, legumes | Lower risk | Strong — consistent across large cohorts, plausible mechanism |
| Sugar-sweetened beverages | Higher risk | Strong observational; persists after weight adjustment |
| Body fatness (especially visceral) | Higher risk | Strong — cohorts plus intervention trials |
| Physical activity | Lower risk, partly independent of weight change | Strong |
| Glycemic index of individual foods | Higher GI, modestly higher risk | Preliminary/mixed — inconsistent across studies |
| Specific "superfoods," cinnamon, chromium | Claimed lower risk | Weak — small trials, surrogate endpoints, poor replication |
The weight question, handled carefully
The strongest prevention evidence in this whole chapter comes from the Diabetes Prevention Program, a randomized trial in adults with prediabetes. An intensive lifestyle program targeting roughly 7% body weight reduction and 150 minutes per week of activity cut new diagnoses of type 2 diabetes by 58% over about three years, outperforming the drug metformin, which cut them by 31%. The Finnish Diabetes Prevention Study found nearly the same figure independently. Later work has shown that substantial weight loss can put type 2 diabetes into remission in a meaningful fraction of people.
Two honest caveats belong beside that result. First, the trial delivered an intensive, supported, expensive program — sixteen structured sessions plus coaching — not an instruction to try harder, and its results say nothing about the worth of anyone who does not reach that outcome. Second, the intervention changed activity, food quality, and weight simultaneously, and activity improves insulin sensitivity even when body weight does not change at all. Metabolic health is not a single number, and improvements in blood pressure, lipids, fitness, and glucose are all real whether or not the scale cooperates.
- Type 2 diabetes combines insulin resistance with failing beta-cell compensation; prediabetes is a fasting glucose of 100–125 mg/dL or HbA1c 5.7–6.4%.
- Carbohydrate RDA is 130 g/day for adults and children (175 g/day pregnancy, 210 g/day lactation); energy yields are 4, 4, 9, and 7 kcal/g for carbohydrate, protein, fat, and alcohol.
- Carbohydrate quality — whole grains and legumes versus sugar-sweetened beverages — predicts risk more consistently than total carbohydrate.
- The Diabetes Prevention Program reduced incident type 2 diabetes by 58% with an intensive supported lifestyle program; activity helps insulin sensitivity independent of weight change.
Section 3Diet and cancer

How the evidence is built — and why it is softer here
Cancer takes decades to develop, which makes it nearly impossible to randomize people to a diet and wait for tumours. Almost all diet-and-cancer evidence therefore comes from observational cohorts supported by mechanism, and the field grades it explicitly: expert panels label conclusions as convincing, probable, limited-suggestive, or insufficient. Learn to look for that label, because the popular press flattens all four into "linked to cancer." The strongest dietary-lifestyle finding is not about any single food at all — excess body fatness is judged to raise the risk of at least a dozen cancers, plausibly through insulin and IGF-1 signalling, chronic inflammation, and increased oestrogen production by adipose tissue.
Fiber, processed meat, and alcohol
Fiber and whole grains. The evidence that whole grains and fiber-containing foods lower colorectal cancer risk is judged strong by expert panels, on the strength of consistent cohort data plus a believable mechanism: fiber speeds transit, dilutes carcinogens, and feeds colonic bacteria that produce butyrate, the preferred fuel of colonocytes. Be honest about the gap, though — randomized trials that added fiber supplements and looked for fewer recurrent adenomas over a few years were null. The most defensible reading is that fiber-rich foods over decades help, and that a fiber supplement bolted onto an otherwise unchanged diet for four years is not the same intervention. Adult fiber Adequate Intakes are 38 g/day for men and 25 g/day for women aged 19–50, falling to 30 g/day and 21 g/day after age 50, derived from about 14 g per 1,000 kcal.
Processed meat. In 2015 the International Agency for Research on Cancer classified processed meat as a Group 1 carcinogen and red meat as Group 2A, based mainly on colorectal cancer. This is the single most misreported result in nutrition. IARC groups describe how certain we are that something can cause cancer, not how much cancer it causes — tobacco smoking and processed meat share Group 1 while differing enormously in effect size. The underlying number: about 50 g of processed meat per day is associated with roughly an 18% higher relative risk of colorectal cancer, which against a modest baseline is a small absolute increase. Plausible mechanisms include N-nitroso compounds from nitrite curing, heterocyclic amines and polycyclic aromatic hydrocarbons formed in high-heat cooking, and heme iron.
Alcohol. Ethanol is also a Group 1 carcinogen, and here the evidence is stronger and the mechanism cleaner. Alcohol dehydrogenase converts ethanol to acetaldehyde, itself a carcinogen that damages DNA; aldehyde dehydrogenase then clears it, and people carrying a low-activity ALDH2 variant — common in East Asian populations, and the cause of the flushing response — accumulate more acetaldehyde and show higher oesophageal cancer risk when they drink. Alcohol is causally linked to cancers of the mouth, pharynx, larynx, oesophagus, liver, colorectum, and female breast, and no threshold below which cancer risk is unaffected has been identified. The old "J-curve" suggesting cardiac benefit from moderate drinking has weakened considerably; much of it appears to reflect former drinkers who quit because they were ill being counted as abstainers, and genetic studies do not support cardioprotection. Ethanol also supplies 7 kcal/g with no nutrient content.
| Exposure | Judgement | What it means in practice |
|---|---|---|
| Alcoholic drinks | IARC Group 1 — carcinogenic to humans | Causal for several cancer sites; no identified safe threshold for cancer |
| Processed meat | IARC Group 1 | Certainty is high; effect size is small — about 18% relative risk per 50 g/day for colorectal cancer |
| Red meat (unprocessed) | IARC Group 2A — probably carcinogenic | Weaker and less consistent than processed meat |
| Whole grains, fiber-rich foods | Probable/convincing protective | Cohorts plus mechanism; fiber supplement trials were null |
| Excess body fatness | Convincing risk factor for many cancers | Acts through insulin/IGF-1, inflammation, oestrogen |
| Beta-carotene supplements (smokers) | Harmful in randomized trials | Two large trials found more lung cancer; supplements are not food |
- Diet-and-cancer evidence is mostly observational and is formally graded; look for the grade before believing the headline.
- Fiber-rich whole foods are linked to lower colorectal cancer risk, while short fiber-supplement trials were null — food and supplement are not interchangeable.
- IARC Group 1 = high certainty of carcinogenicity, not high magnitude; processed meat carries roughly an 18% relative risk increase per 50 g/day for colorectal cancer.
- Alcohol is causally linked to at least seven cancer sites via acetaldehyde, with no identified safe threshold, and supplies 7 kcal/g.
Section 4Diet and bone health
Bone is a bank account you fill early
Bone is living tissue in permanent turnover: osteoclasts resorb it, osteoblasts rebuild it, and the balance between them shifts across the lifespan. Deposition outpaces resorption through childhood and adolescence, so that most adults reach peak bone mass — the maximum bone they will ever have — by their late twenties. After that the balance tips toward net loss, slowly at first and then rapidly in women for several years after menopause when oestrogen withdrawal accelerates resorption. This is why calcium requirements peak in adolescence rather than in old age, and why loading the skeleton with weight-bearing activity in youth pays dividends decades later.
Osteoporosis is the endpoint: bone mass low enough and microarchitecture degraded enough that fractures occur under trivial loads. It is defined on bone densitometry as a T-score of −2.5 or lower, with −1.0 to −2.5 called osteopenia. It is silent until it breaks something — classically hip, vertebra, or wrist — and hip fracture in an older adult carries substantial mortality.
Calcium and vitamin D: the numbers
Calcium RDAs in the United States are 1,300 mg/day for ages 9–18, 1,000 mg/day for men aged 19–70 and women aged 19–50, and 1,200 mg/day for women aged 51 and older and men aged 71 and older. Pregnancy and lactation do not raise the adult requirement — maternal absorption efficiency rises instead. The Tolerable Upper Intake Level is 2,500 mg/day for adults aged 19–50 and 2,000 mg/day from 51 on; chronically exceeding it is associated with kidney stones and hypercalcaemia.
Vitamin D is not really a vitamin — skin makes it from 7-dehydrocholesterol under UVB light — but latitude, season, sunscreen, clothing, skin pigmentation, and indoor life make dietary intake matter. Its job in bone is indirect and essential: calcitriol drives intestinal calcium absorption. The RDA is 600 IU (15 mcg)/day for ages 1–70, including pregnancy and lactation, and 800 IU (20 mcg)/day from age 71, with a Tolerable Upper Intake Level of 4,000 IU (100 mcg)/day for adults. Severe deficiency produces rickets in growing children, where unmineralized growth plates bow under load, and osteomalacia in adults, a soft-bone syndrome with bone pain and weakness — distinct from osteoporosis, in which the bone is normally mineralized but there is simply less of it.
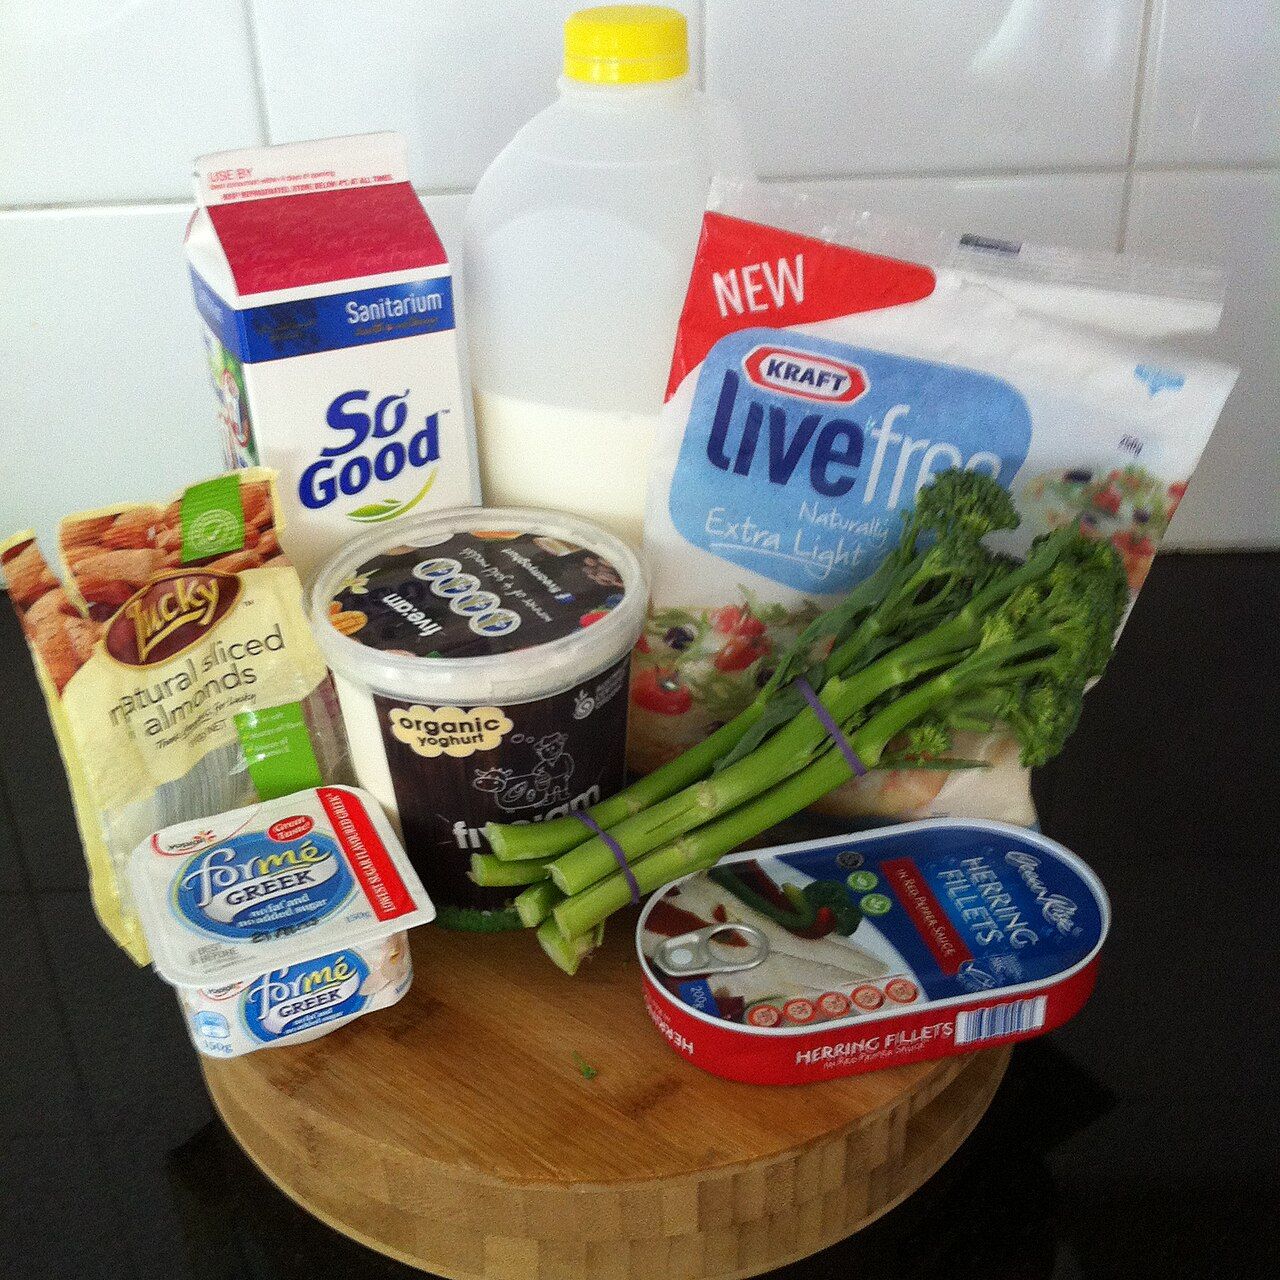
Absorption is where dietary detail earns its keep. Roughly 30% of the calcium in milk is absorbed; low-oxalate greens such as kale and bok choy do better per unit calcium, while spinach, despite a high calcium content, is nearly useless as a source because oxalate binds the mineral. Fractional absorption falls as a single dose rises, so calcium spread across the day is absorbed more efficiently than the same amount taken at once. Adequate protein supports bone rather than harming it — the old "acid-ash" idea that dietary protein leaches calcium from the skeleton has not survived testing. Very high sodium intakes do modestly increase urinary calcium loss, one more reason the sodium discussion in Section 1 keeps reappearing.
| Nutrient | Reference intake (adults) | Notes and variation | Deficiency |
|---|---|---|---|
| Calcium | RDA 1,000 mg/day (men 19–70; women 19–50) | 1,200 mg/day women 51+ and men 71+; 1,300 mg/day ages 9–18; UL 2,500 mg/day (19–50), 2,000 mg/day (51+) | Low peak bone mass; contributes to osteoporosis |
| Vitamin D | RDA 600 IU (15 mcg)/day, ages 1–70 | 800 IU (20 mcg)/day from age 71; unchanged in pregnancy/lactation; UL 4,000 IU (100 mcg)/day | Rickets (children), osteomalacia (adults) |
| Protein | RDA 0.8 g/kg body weight/day | Higher in pregnancy, lactation, and likely in older adults | Muscle and bone loss; poor fracture recovery |
| Vitamin K | AI 120 mcg/day (men), 90 mcg/day (women) | Needed to carboxylate osteocalcin; supplement trials for fracture are preliminary | Impaired clotting; bone role less certain |
| Magnesium | RDA 400–420 mg/day (men), 310–320 mg/day (women) | Varies with age; structural component of bone mineral | Hypocalcaemia, neuromuscular irritability |
- Peak bone mass is reached by the late twenties; adolescence is the highest-requirement window (calcium RDA 1,300 mg/day, ages 9–18).
- Adult calcium RDA is 1,000 mg/day, rising to 1,200 mg/day for women 51+ and men 71+; UL 2,500 mg/day (19–50) and 2,000 mg/day (51+).
- Vitamin D RDA is 600 IU (15 mcg)/day to age 70 and 800 IU (20 mcg)/day after; deficiency causes rickets in children and osteomalacia in adults.
- Bioavailability matters — oxalate in spinach blocks calcium absorption, while low-oxalate greens and fortified foods deliver it well.
Section 5Dietary patterns
Why patterns beat single nutrients
The history of nutrition research is littered with nutrients that looked essential in observational data and then failed, or backfired, in trials. Beta-carotene tracked with lower lung cancer risk in cohorts; two large randomized trials in smokers found more lung cancer in the supplemented groups. High-dose vitamin E was expected to prevent prostate cancer and modestly increased it. Antioxidant supplements broadly have not reproduced the benefits of antioxidant-rich diets. The pattern in these failures is instructive.
There are four reasons the single-nutrient approach keeps failing. The food matrix matters — a nutrient arrives inside a structure of fiber, water, and thousands of other compounds that changes its absorption and effect. Nutrients interact — calcium needs vitamin D; iron absorption depends on vitamin C and is blocked by phytate. Diets are substitutions, not additions — eating more legumes means eating less of something else, and the study measures the swap. And nutrients travel together, so the "effect" of one is statistically tangled with everything else that keeps it company on the plate. A dietary pattern captures all four automatically. That is not a rhetorical preference; it is the best available explanation for why pattern-level trials have succeeded where nutrient-level trials have not.
Three patterns with real trial evidence
Mediterranean. Built on vegetables, fruit, legumes, whole grains, nuts, fish, and extra-virgin olive oil as the principal fat, with modest dairy and little red or processed meat. The PREDIMED trial randomized about 7,400 adults at high cardiovascular risk and found roughly a 30% relative reduction in major cardiovascular events in the Mediterranean-diet groups. Two caveats belong with that number: the trial was retracted and republished in 2018 after randomization irregularities were found at some sites, with broadly similar conclusions on reanalysis, and the participants were at high baseline risk, so the absolute benefit in a low-risk population would be smaller.
DASH. Dietary Approaches to Stop Hypertension is the cleanest feeding trial in the field: fruit, vegetables, low-fat dairy, whole grains, nuts, and reduced saturated fat, with all food provided and body weight held constant. It lowered systolic blood pressure by about 5.5 mmHg overall and by roughly 11 mmHg in participants who already had hypertension — drug-like effects from food alone, over eight weeks. The follow-on DASH-Sodium trial showed the pattern and sodium reduction were additive, with the largest reductions when both were applied.
Plant-based. A spectrum rather than a category, from fully vegan through vegetarian to mostly-plant omnivorous. Large cohorts of vegetarians report lower rates of type 2 diabetes, lower blood pressure, and lower cardiovascular mortality. This evidence is observational, and vegetarians in these cohorts also smoke less and exercise more, so residual confounding is a real concern. It also matters which plant-based diet: a pattern of whole grains, legumes, nuts, and vegetables behaves very differently from one built on refined starch and sugar, even though both are technically plant-based. Fully plant-based eating requires planned attention to vitamin B12, which occurs naturally only in animal foods, and often to iron, zinc, iodine, calcium, and long-chain omega-3s.
| Pattern | Defining features | Best-supported outcome | Evidence type |
|---|---|---|---|
| Mediterranean | Olive oil as main fat; vegetables, legumes, nuts, fish; little processed meat | Fewer major cardiovascular events | Randomized trial in high-risk adults, plus cohorts |
| DASH | Fruit, vegetables, low-fat dairy, whole grains, nuts; low saturated fat and sodium | Blood pressure reduction (about −5.5 mmHg systolic; more if hypertensive) | Controlled feeding trial — strongest design available |
| Plant-based / vegetarian | Little or no animal food; quality varies enormously within the category | Lower type 2 diabetes and cardiovascular mortality | Observational cohorts — confounding possible |
| Traditional Okinawan, Nordic, and others | Regionally distinct, share the same base foods | Similar directional benefits | Mostly observational; growing |
What they share — and what "healthy" cannot mean
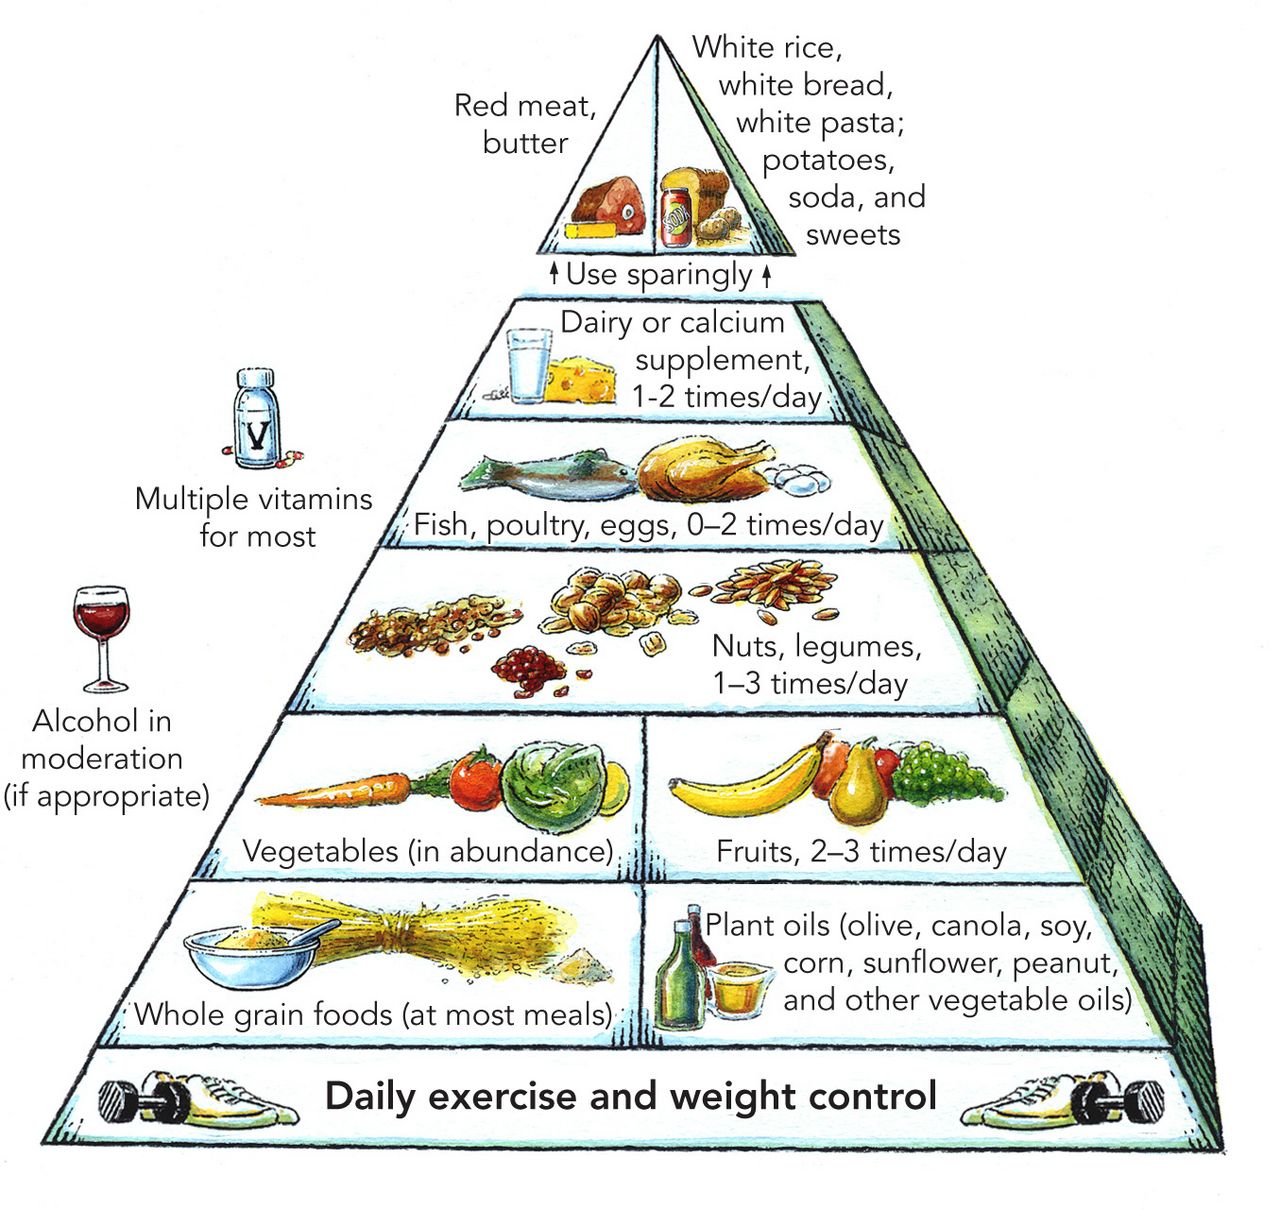
Line the successful patterns up and the overlap is more striking than the differences: plenty of vegetables, fruit, legumes, whole grains, and nuts; unsaturated fat as the main fat; fish or plant proteins in place of much processed meat; limited added sugar, sodium, and ultra-processed food. Beyond that, the patterns diverge freely on dairy, on meat, on grain type, on cooking fat — and they succeed anyway. There is no single correct diet, and the same principles can be expressed through Mediterranean, South Asian, West African, Latin American, East Asian, or any other cuisine.
Two practical honesties finish the chapter. First, adherence beats optimization — a pattern a person can actually eat, afford, buy near home, and cook produces better outcomes than a theoretically superior pattern they abandon in a month. Second, food is not a moral test. Cost, time, transport, culture, family, disability, and food environment shape what lands on a plate at least as much as knowledge does, and framing eating as virtue and vice reliably makes both nutrition and mental health worse. The clinical and educational job is to describe physiology and evidence accurately, and to leave the moralizing out of it.
- Single-nutrient supplement trials have repeatedly failed because of the food matrix, nutrient interactions, substitution effects, and correlated intakes.
- PREDIMED (Mediterranean) reduced major cardiovascular events by roughly 30% in high-risk adults; the trial was retracted and republished in 2018 with similar conclusions.
- DASH lowered systolic blood pressure by about 5.5 mmHg overall and roughly 11 mmHg in hypertensive participants, with sodium reduction additive.
- Successful patterns overlap heavily in their base foods; adherence, affordability, and cultural fit matter more than choosing between them.
The chapter in one breath
- LDL cholesterol is causal in atherosclerosis; saturated and industrial trans fats raise it, and unsaturated fats lower it when they replace saturated fat — substitution is the question.
- Adult sodium references are an AI of 1,500 mg/day and a CDRR of 2,300 mg/day against an average intake near 3,400 mg/day, most of it from packaged and restaurant food; potassium AI is 3,400 mg/day (men) and 2,600 mg/day (women).
- Type 2 diabetes is insulin resistance plus beta-cell failure; carbohydrate quality tracks risk better than quantity, and the RDA for carbohydrate is 130 g/day (175 g/day pregnancy, 210 g/day lactation).
- The Diabetes Prevention Program cut incident diabetes by 58% with an intensive supported lifestyle program — and activity improves insulin sensitivity even without weight change.
- Diet-and-cancer evidence is mostly observational and formally graded; IARC Group 1 signals certainty, not magnitude, and processed meat carries about an 18% relative risk increase per 50 g/day for colorectal cancer.
- Alcohol is a Group 1 carcinogen acting through acetaldehyde, with no identified safe threshold for cancer, and it supplies 7 kcal/g (carbohydrate and protein 4, fat 9).
- Bone: peak mass by the late twenties; calcium RDA 1,000 mg/day for most adults (1,200 mg/day for women 51+ and men 71+, 1,300 mg/day ages 9–18) and vitamin D 600 IU (15 mcg)/day to age 70, 800 IU (20 mcg)/day after — deficiency causing rickets or osteomalacia.
- Dietary patterns — Mediterranean, DASH, well-planned plant-based — outperform single nutrients because food comes as a matrix, nutrients interact, and every choice is a substitution.
ReferenceWords worth knowing
A quick reference for the terms in this chapter — skim it now, or circle back whenever a word trips you up.
- Added sugars
- Sugars and syrups added during processing or preparation, as opposed to those naturally present in fruit or milk; United States guidance recommends keeping them under 10% of daily energy for ages 2 and older.
- Atherosclerosis
- The build-up of lipid-rich plaque within artery walls, driven substantially by LDL particles that lodge and are oxidized there.
- Bone mineral density
- The amount of mineral per unit area of bone, measured by densitometry and reported as a T-score; the standard for diagnosing osteoporosis.
- Cardiovascular disease
- Umbrella term for disorders of the heart and blood vessels, including coronary artery disease, stroke, and peripheral arterial disease.
- DASH diet
- Dietary Approaches to Stop Hypertension — a controlled-trial pattern of fruit, vegetables, low-fat dairy, whole grains, and nuts that lowers blood pressure independent of weight change.
- Dietary fiber
- Carbohydrate that resists human digestive enzymes; Adequate Intakes are about 14 g per 1,000 kcal, or 38 g/day for men and 25 g/day for women aged 19–50.
- Dietary pattern
- The overall combination of foods and beverages habitually consumed, analysed as a whole rather than nutrient by nutrient.
- Glycemic index
- A ranking of how much an isolated carbohydrate food raises blood glucose relative to a reference; useful conceptually, but inconsistent as a standalone predictor in mixed meals.
- HbA1c
- Glycated haemoglobin, reflecting average blood glucose over roughly the previous two to three months; 5.7–6.4% indicates prediabetes and 6.5% or higher is diagnostic of diabetes.
- Insulin resistance
- Reduced responsiveness of muscle, liver, and adipose tissue to insulin, requiring higher insulin output to maintain normal blood glucose.
- LDL cholesterol
- Cholesterol carried on low-density lipoprotein particles; causally linked to atherosclerotic cardiovascular disease.
- Mediterranean diet
- A pattern centred on vegetables, legumes, whole grains, nuts, fish, and olive oil as the principal fat, with limited red and processed meat.
- Osteomalacia
- Softening of adult bone from inadequate mineralization, usually reflecting vitamin D or calcium deficiency; the adult counterpart of rickets.
- Osteoporosis
- Low bone mass with degraded microarchitecture and increased fracture risk, defined as a T-score of −2.5 or lower; the remaining bone is normally mineralized.
- Peak bone mass
- The greatest amount of bone tissue a person accrues, typically reached by the late twenties, after which net loss begins.
- Prediabetes
- Blood glucose above normal but below diagnostic thresholds — fasting glucose 100–125 mg/dL or HbA1c 5.7–6.4%.
- Processed meat
- Meat preserved by smoking, curing, salting, or the addition of chemical preservatives; classified by IARC as Group 1 based on colorectal cancer evidence.
- Saturated fat
- Fatty acids with no carbon–carbon double bonds; raises LDL cholesterol relative to unsaturated fat.
- Sodium
- The cation whose intake most strongly influences blood pressure; adult AI 1,500 mg/day, with a Chronic Disease Risk Reduction intake of 2,300 mg/day.
- Trans fat
- Unsaturated fat with at least one double bond in the trans configuration; the industrial form from partially hydrogenated oil raises LDL and lowers HDL and has been largely removed from the food supply.
- Unsaturated fat
- Fatty acids containing one (monounsaturated) or more (polyunsaturated) double bonds; lowers LDL when substituted for saturated fat.
- Whole grain
- A grain retaining bran, germ, and endosperm in their original proportions; consistently associated with lower type 2 diabetes and colorectal cancer risk.